 شركة ونزو كايشين كايشين كايشين للمعادن المحدودة

Understanding Surface Finish Chart Standards
Surface finish charts help engineers, buyers, machinists, mold makers, and quality teams describe how a surface should look and feel before a part is made. A good chart turns vague words like “smooth,” “matte,” or “polished” into measurable or inspectable requirements, reducing confusion between design intent and production reality. This guide explains how surface finish standards work, how to read common chart formats, and how to use a surface finish conversion chart without treating approximate values as exact equivalents.
What does a surface finish chart actually standardize?
A surface finish chart standardizes the language used to describe surface texture, but it does not always standardize the manufacturing process that creates it. In practice, a finish surface chart may show roughness values, visual grades, polishing methods, molded texture references, or conversions between systems so different teams can align on expectations.
The key point is that “surface finish” is broader than one number. Technical standards often distinguish roughness, waviness, and lay because a surface can have fine tool marks, broader undulations, and a directional pattern at the same time. ASME B46.1 covers surface texture topics including roughness, waviness, and lay, while ISO 21920 defines profile-based surface texture rules, terms, and parameters for technical product documentation. (webstore.ansi.org)
That distinction matters because two parts can have a similar average roughness value and still look different. One may appear glossy because its peaks and valleys are shallow and consistent. Another may scatter light because the lay direction, texture depth, or molding material changes the appearance. A surface finish chart gives teams a shared starting point, but the drawing note, inspection method, material, and sample approval process complete the requirement.
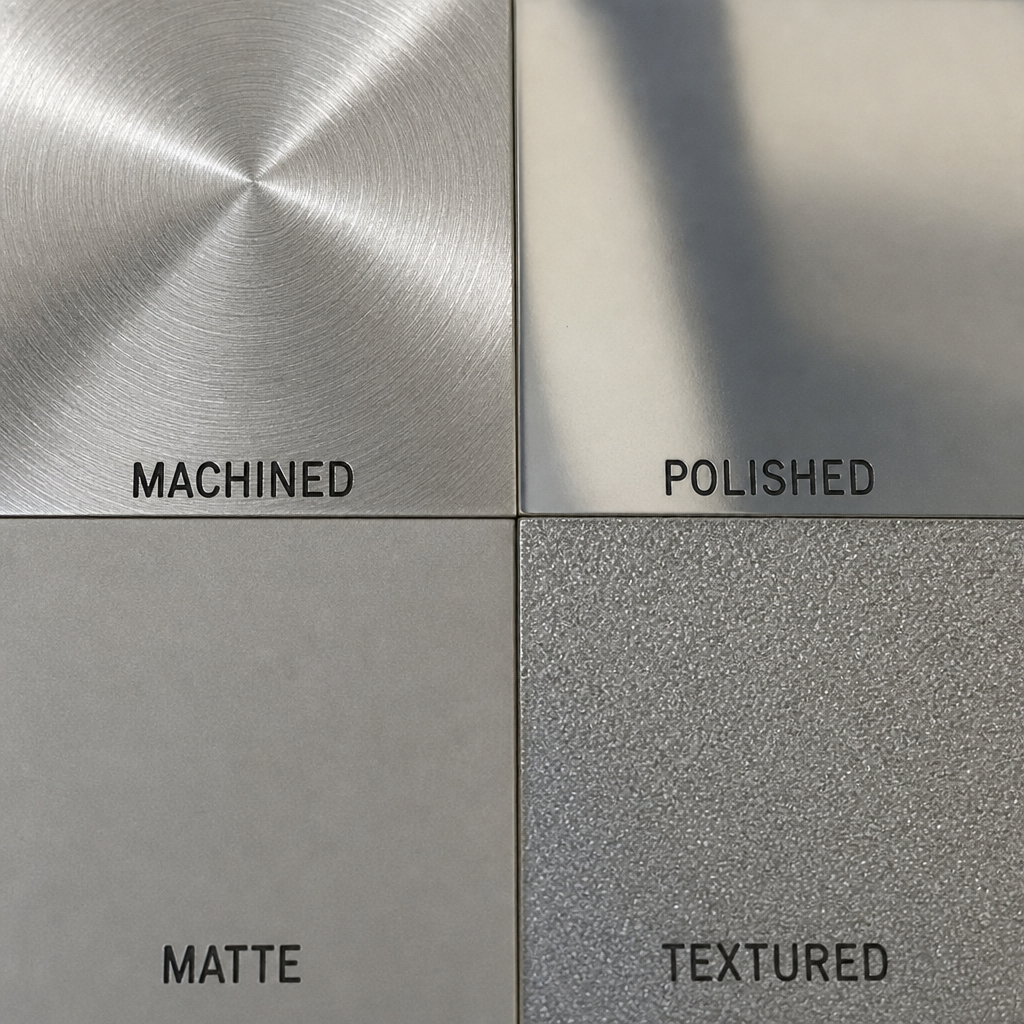
close-up comparison of machined, polished, matte, and textured surface samples
Surface finish terminology that charts rely on
Most surface finish standards begin with measurement language. If the terms are misunderstood, the chart can create a false sense of precision. The most common mistake is assuming every chart value converts perfectly into every other system.
Roughness
Roughness describes the fine, closely spaced irregularities on a surface. These are often caused by machining, grinding, polishing, blasting, etching, or the texture of a mold cavity. Roughness is usually the parameter people mean when they ask for a surface finish chart, because it can be expressed as values such as Ra or Rz.
Ra is the arithmetic average roughness, which makes it useful for general comparison. However, Ra can hide differences in peak height, valley depth, and spacing. For functional surfaces such as seals, bearings, sliding fits, or cosmetic housings, Ra alone may not describe the whole performance requirement.
Waviness
Waviness refers to broader surface variations that occur over longer spacing than roughness. It may come from vibration, machine deflection, heat treatment distortion, molding behavior, or fixturing issues. A part can have a fine Ra value and still fail a visual or sealing requirement if waviness is excessive.
This is why surface finish standards separate roughness from waviness. The separation helps a drawing clarify whether the concern is micro-texture, larger shape variation, or both.
Lay
Lay is the dominant direction of the surface pattern. On a turned part, the lay may be circular. On a milled part, it may follow the cutter path. On a brushed decorative panel, lay may be the main visual feature.
A surface texture chart may show lay symbols or examples because direction affects friction, fluid flow, reflectivity, and appearance. If lay direction matters, it should be called out explicitly rather than assumed from the roughness value.
Major surface finish standards and chart systems
Surface finish standards differ by industry and part type. Metal machining, molded plastics, castings, coatings, and decorative parts may all use different conventions. The right chart is the one that matches the process, material, and inspection method.
ISO and ASME surface texture standards
ISO 21920 is part of the ISO geometrical product specifications system and addresses profile-based surface texture indication, terms, and parameters. It is especially relevant when surface texture must be shown clearly on technical drawings using standardized symbols and parameter definitions. (iso.org)
ASME B46.1 is widely referenced in North American engineering contexts for surface texture requirements. ANSI’s listing describes ASME B46.1-2019 as covering surfaces produced by methods such as abrading, casting, coating, cutting, etching, plastic deformation, sintering, wear, and erosion. (webstore.ansi.org)
These standards are most useful when a surface can be measured with defined methods. They help teams avoid vague requirements by specifying the parameter, cutoff, evaluation length, and other conditions needed for repeatable measurement.
SPI surface finish chart for injection molding
The SPI surface finish chart is commonly used for plastic injection molded parts. It groups mold finishes into categories such as high-gloss diamond polish, semi-gloss paper polish, matte stone finish, and textured blasted finish. Commercial SPI chart references commonly show twelve grades, often labeled A-1 through D-3, with typical roughness ranges and finishing methods.
An SPI surface finish chart is especially useful because molded plastic appearance depends on the mold cavity surface. If the cavity is polished, blasted, or textured, the molded part usually reflects that surface character, although resin choice, color, fillers, tool condition, and processing parameters can influence the final look.
Use SPI callouts carefully. A note such as “SPI B-2” is more useful than “smooth black plastic,” but it still benefits from a physical sample, defined inspection lighting, and agreement about acceptable variation.
VDI, Mold-Tech, and other texture references
Some molded parts use VDI texture references, Mold-Tech texture numbers, or proprietary texture plaques instead of SPI grades. These systems are common when the requirement is visual and tactile rather than simply polished or matte. Automotive interiors, consumer electronics, appliance housings, and grip surfaces often need a controlled texture pattern rather than a generic roughness value.
A surface texture chart for these applications may show texture depth, draft recommendations, visual plaques, or material notes. Because textured surfaces can lock into the mold during ejection, draft angle and part geometry become part of the finish discussion, not a separate afterthought.
Common surface finish types and what they mean
Surface finish types are often grouped by appearance, process, or function. A practical surface finish chart should help readers connect those groups to real design decisions.
Polished and mirror-like finishes
Polished finishes are used when appearance, transparency, cleanability, or low light scattering matters. In injection molding, the SPI A family is generally associated with diamond-buffed, high-gloss finishes. In machining, polishing or lapping may be used after cutting or grinding to reduce visible tool marks.
These finishes can be expensive or time-consuming because they require careful tool preparation and defect control. They may also reveal scratches, sink marks, weld lines, and contamination more easily than matte finishes. When choosing a high-gloss finish, designers should consider whether the material and part geometry can support the desired appearance.
Semi-gloss finishes
Semi-gloss finishes balance appearance and practicality. They can look refined without demanding the same level of mold polish as a mirror finish. SPI B grades are often used as semi-gloss references in molded plastic chart systems.
This finish type works well when the product should look clean and intentional but does not need a reflective surface. It may also hide minor handling marks better than a full gloss finish.
Matte and satin finishes
Matte and satin finishes reduce glare and can make a product feel softer or more technical. In mold finishing, stone-polished and lightly blasted finishes often fall into this family. In metalworking, bead blasting, brushing, anodizing preparation, or fine abrasive finishing may create similar visual results.
Matte does not automatically mean rough. A surface can look matte because it scatters light evenly, even if its roughness is controlled. That is why visual standards, samples, and roughness values should be used together when appearance is critical.
Textured finishes
Textured finishes add a deliberate pattern or tactile feel. They can improve grip, hide fingerprints, mask minor cosmetic defects, or support a brand’s visual identity. For molded parts, the texture must be compatible with draft, resin flow, wall thickness, and ejection direction.
Texture depth matters. A deeper texture usually needs more draft and more careful mold design, while a shallow texture may be easier to mold but less effective at hiding blemishes.
How should you read a surface finish conversion chart?
A surface finish conversion chart should be read as a comparison tool, not a universal translator. It can help you relate Ra in microinches to Ra in micrometers, compare roughness grade numbers, or approximate an SPI finish against a measured roughness range, but it cannot guarantee identical appearance or performance across different processes.
For example, a machined metal surface with a certain Ra value may not look like a molded plastic surface with the same approximate Ra. The material reflects light differently, the lay may differ, and the manufacturing process creates different peak and valley shapes. Conversion is useful for communication, but validation still depends on measurement, inspection, and samples.
When using a surface finish conversion chart, check these details:
- Parameter being converted: Confirm whether the chart uses Ra, Rz, RMS, roughness grade, SPI grade, or another reference.
- Unit system: Distinguish micrometers from microinches. A unit mistake can change the requirement dramatically.
- Process context: Do not assume a molded finish, ground finish, turned finish, and blasted finish are visually equivalent.
- Inspection method: Measurement equipment, cutoff settings, stylus condition, and sampling direction can affect results.
- Supplier note: Many charts use typical ranges. Treat them as planning values unless the supplier agrees to them as acceptance criteria.
A practical way to specify surface finish on drawings
The best surface finish callout is specific enough to be inspected and flexible enough to be manufactured reliably. It should tell the supplier what matters: appearance, roughness, friction, sealing, cleanability, wear, or brand feel.
For precision parts, a technical drawing may need a formal surface texture symbol, a roughness parameter, a maximum value, and the applicable standard. For molded cosmetic parts, the drawing may need an SPI grade, texture reference, plaque number, surface map, and sample approval requirement. For decorative parts, the callout may need finish locati0n, grain direction, color, coating, and viewing criteria.
A strong specification often includes:
- Finish designation, such as an SPI grade, Ra value, or texture number.
- Applicable surface area, because not every face of a part needs the same finish.
- Material and process assumptions, especially for plastics, coatings, and post-processing.
- Inspection method, including whether the finish is measured, visually inspected, or compared to a sample.
- Acceptance sample, when appearance matters more than a single numerical value.
- Notes for exceptions, such as hidden surfaces, parting lines, ejector marks, gates, or secondary operations.
This approach prevents over-specification. Requiring a premium finish on every surface can increase tooling effort, polishing time, inspection burden, and rework risk without improving the part where users actually see or touch it.
Choosing the right chart for your application
The right surface finish chart depends on how the surface will be made and how success will be judged. A single downloadable surface finish chart PDF can be helpful for training or quick reference, but production decisions should be tied to the correct standard, supplier capability, and inspection plan.
Use this selection checklist:
- For machined metal parts: Start with ISO or ASME surface texture requirements, then define the parameter, value, and inspection conditions.
- For plastic injection molded parts: Use an SPI surface finish chart, VDI reference, Mold-Tech texture, or approved sample depending on the cosmetic goal.
- For cast, forged, or additive parts: Confirm whether roughness, porosity, coating preparation, or post-processing is the real requirement.
- For sealing or sliding surfaces: Go beyond appearance and define the functional parameter that affects performance.
- For visible consumer surfaces: Use samples, lighting conditions, viewing distance, and defect limits along with the chart reference.
- For supplier quoting: Share the finish surface chart reference early so tooling, cycle time, secondary finishing, and inspection can be estimated realistically.
A surface finish chart works best when it supports a conversation rather than replacing one. If the part is cosmetic, ask for sample plaques or previous examples. If the part is functional, ask how the supplier will measure and document the finish.
Common mistakes when using surface finish charts
The first common mistake is using a chart value without naming the standard or parameter. “32 finish” may be understood in one shop but ambiguous in another, especially across regions or industries. Always include units and context.
The second mistake is treating SPI grades as pure roughness numbers. SPI grades describe mold finishing categories, not just measured part roughness. The molded result can vary with resin, pigment, filler, mold steel, and processing.
The third mistake is specifying a finish that conflicts with part geometry. Deep textures on vertical mold walls may require additional draft. High-gloss finishes may expose sink, flow lines, scratches, or weld lines that a satin finish would soften visually.
The fourth mistake is applying one finish to the entire part. Hidden faces, shutoff areas, ribs, internal bosses, and functional surfaces may need different requirements. A surface map can save cost and reduce disputes.
The fifth mistake is relying on a surface finish chart pdf found online without confirming it matches the supplier’s process. Charts are useful references, but the production agreement should define what will be inspected and how disagreements will be resolved.
Best practices for reliable finish communication
Good finish communication is both technical and visual. The more cosmetic the requirement, the more important it is to show examples. The more functional the requirement, the more important it is to define measurement conditions.
Before releasing a drawing or purchase order, review these questions with the team:
- What is the purpose of the finish: appearance, touch, friction, sealing, cleanability, or wear?
- Which surfaces actually need the requirement?
- Is the finish described by a recognized standard, supplier chart, or approved sample?
- Are units, parameters, and grade names written clearly?
- Will the finish be inspected by instrument, visual comparison, or both?
- Does the material support the intended finish?
- Could the finish affect tooling cost, lead time, draft, ejection, or secondary operations?
- Has the supplier confirmed the callout is achievable and inspectable?
This checklist turns a surface finish chart from a static reference into a practical quality tool. It helps design, purchasing, manufacturing, and inspection teams make the same decision from the same information.
Final takeaways
Surface finish standards make surface requirements clearer, but they are not interchangeable shortcuts. ISO and ASME standards are useful for measured surface texture, while the SPI surface finish chart and other texture systems are practical references for molded plastic appearance. A surface finish conversion chart can bridge terminology, but it should not replace a correct callout, supplier review, and sample approval.
When in doubt, define the surface by its purpose. If the surface must seal, measure the functional texture. If it must look premium, use visual standards and samples. If it must be affordable and consistent, specify only the surfaces and finish levels that truly matter.
 English
 Afrikaans
 Arabic
 Bengali
 Catalan
 Chinese
 French
 Dutch (Belgium)
 Dutch
Dutch German
 Czech
Czech Greek
Greek Hindi
Hindi Japanese
 Italian
 Portuguese
 Spanish (Chile)
 Spanish (Colombia)
 Spanish (Argentina)
 Persian
 Estonian
 Albanian
 Russian
 Spanish (Peru)
 Indonesian
 Thai
Thai Vietnamese
 Georgian
 Bhojpuri
 Moroccan Arabic
 Korean
 Nepali
 Polish
 Ukrainian
 Malayalam
 Xhosa
Xhosa